Views > Financial modeling > How accurate are your IRRs and NPVs
“Accuracy builds credibility.”
Jim Rohn
American author and motivational speaker
The accuracy of your IRRs and NPVs depends to a large extent on the quality of the assumptions that go into the financial model—such as construction costs, sales assumptions and absorption rates among others. However, there is one element—usually omitted by practitioners—that also affects the accuracy of the calculations. We're talking here about the number of time periods used to calculate those IRRs and NPVs. A rule of thumb states that intervals should be selected to cover 8 to 12 periods of analysis. In this entry we'll show you the effect of using smaller or larger number of time intervals on the accuracy of IRRs and NPVs.
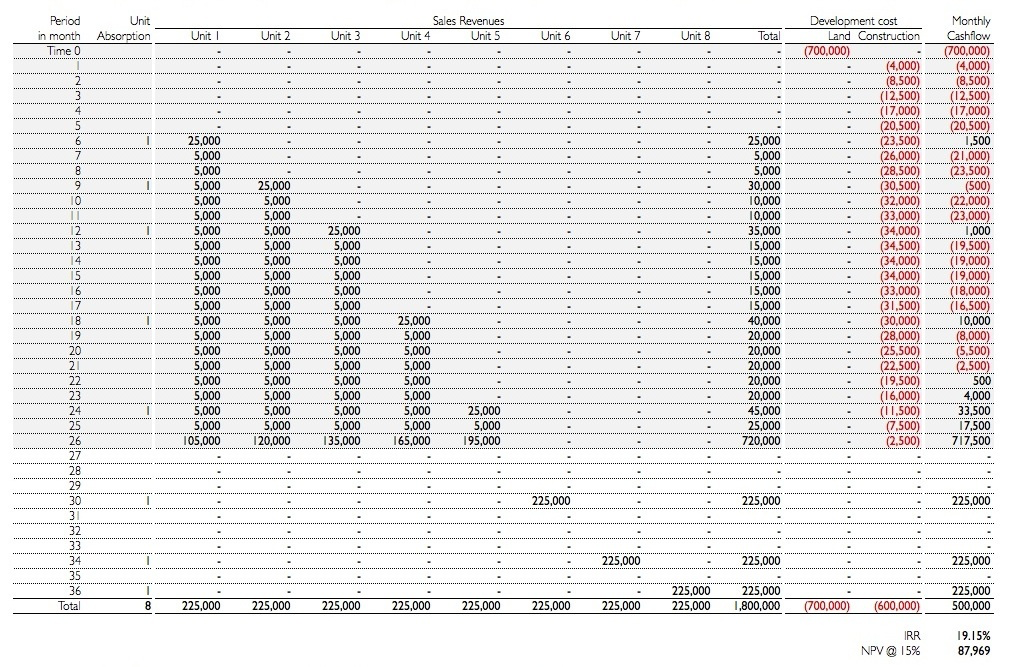
To clarify the mechanics of this problem, let's take an example. Suppose that on a certain parcel of land worth $700,000, you could build eight townhouses for a total construction cost of $600,000. The construction of the project is expected to take 26 months to complete. You expect to sell the eight units within three years—in the 6th, 9th, 12th, 18th, 24th, 30th, 34th and 36th month respectively—for a total sale price of $1.8 million.
Assuming there'll be no price escalations, market sales prices seem to be around $225,000 per townhouse. After each sale, you'll receive $25,000 as a down payment, followed by equal monthly installments of $5,000 till the delivery of the product—where the balance is paid down completely. Any sale that takes place after the end of the construction period will be paid down completely at the date of sale.
The following table shows the projected monthly draws to pay the construction costs along with the sales revenues. The resulting monthly net cash flow is also presented resulting in an IRR of 19.15% per year and an NPV of $87,969 for an annual required rate of return of 15%—or 1.25% per month.
For the sake of simplicity, we've omitted the effect of financing and taxes on the calculations.
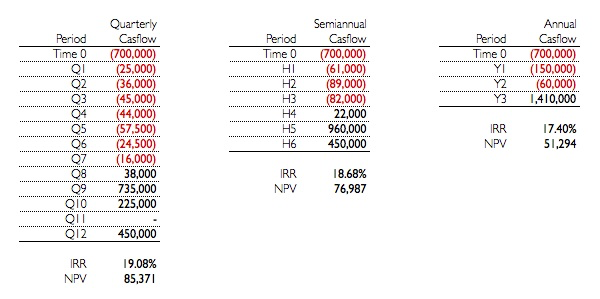
If we use quarterly time periods (three months per period) instead of monthly time periods, 12 total periods would result and the resulting IRR and NPV would be 19.08% and $85,371 respectively. Semiannual time periods would give six time periods and annual intervals would provide three time periods. Note that different aggregations of cash flows produce different IRR and NPV results—as shown in the following table.
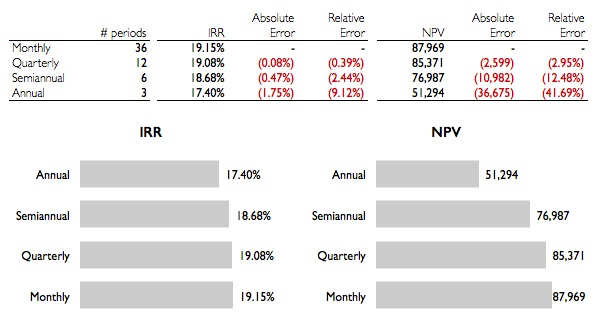
The resulting margin of errors between the different time interval aggregations can be seen in the following table.
Two things are worth noting:
-
The NPV is more sensitive to time intervals than the IRR.
-
The margin of error increases with reduced number of time intervals.
From the above we've seen that the IRRs and NPVs are sensitive to the number of time intervals used in the calculations. The accuracy of the results increases with the increase in the number of time periods. We recommend the use of larger number of time periods in line with the rule of thumb of 8 to 12 periods of analysis as a minimum.

HOW ACCURATE ARE YOUR IIRs AND NPVs
HOW ACCURATE ARE YOUR IIRs NPVs


